Last weekend I participated in the Open Data Day Hackathon in Cluj-Napoca. I was glad to see that there were other people nearby interested in open data.
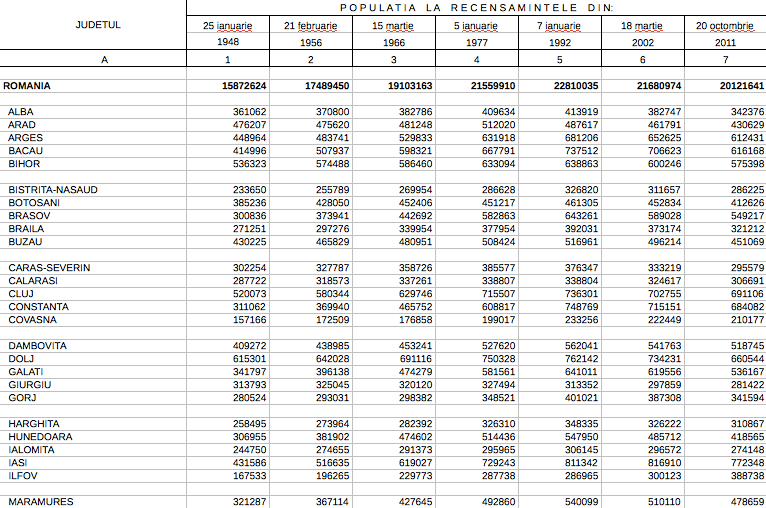
My idea was to make a 3D map of Romania, with each county elevated according to its population. It was really satisfying to go from this:
to this:
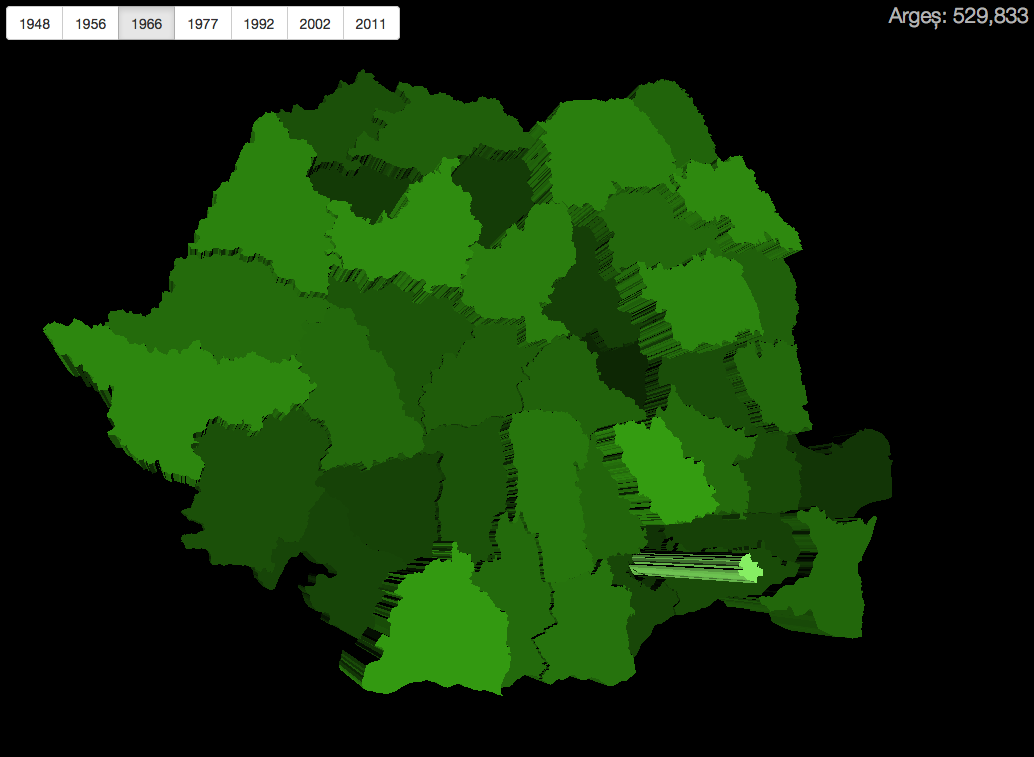
Here’s a live demo (requires a browser with WebGL support).
The main advantage of this visualization mode is that you can see all the counties at once, so you get a holistic sense of population distribution, as well as population density.
Features
You can select the census year to view data from. If you hover over a county with the mouse (or tap on it on a touchscreen), you can see the county name and population count in the upper-right corner.
The map can be tilted by dragging and zoomed by scrolling, so you can get the best view of a particular area.
Implementation
From a topojson file, the geographic data for each county is projected to a 2D path using D3. This path is then converted to 3D geometry using d3-threeD and extruded based on the census data. Finally, the geometry is rendered using three.js. The approach was inspired by Jos Dirksen’s post.
One thing I learned is that d3-threeD chokes on shapes with holes in them, so I had to remove them.
To detect hovering over a particular county, a raycaster is used to find if there’s an interesection between the cursor position and any of the county meshes.
For UI rendering I used React, mostly because I wanted to play with it.
For more details about the implementation, check out the source code.