I don’t know about you, but I think Travis CI is the best thing that happened to open-source development since Github.
I noticed that my builds seemed to be getting slower lately. Looking at the build history in the regular Travis CI interface wasn’t very conclusive, because you can only see 10 or 20 builds at a time:
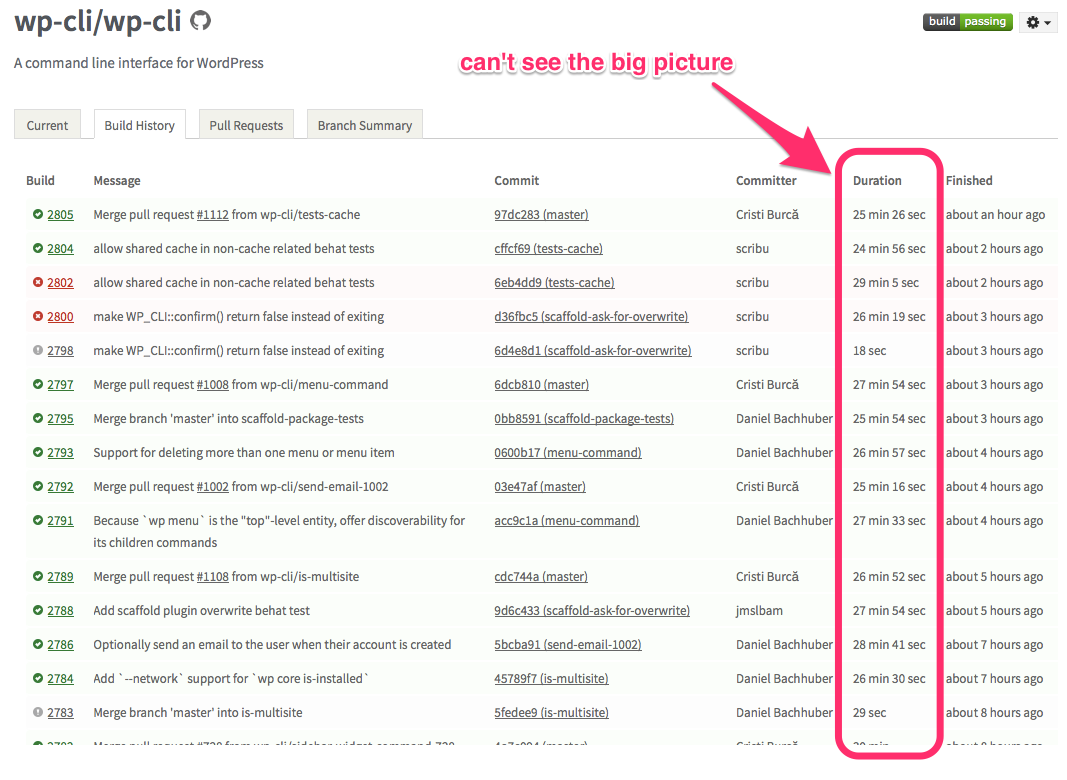
Even after pressing the “Show more” button repeadetly, I still wasn’t sure that it wasn’t just a random fluctuation. What I needed was to see all the builds at the same time.
After a few hours of reading the Travis API docs and fiddling with D3, this is what I came up with:
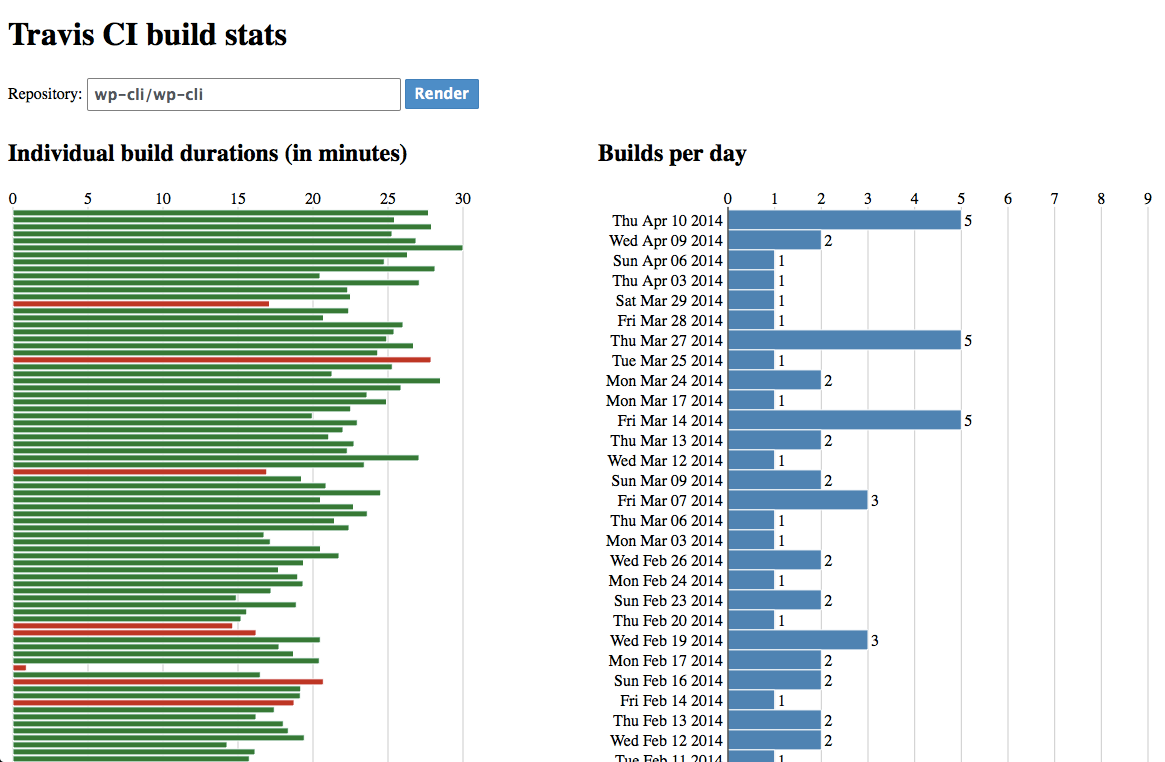
It incrementally loads the most recent ~500 builds and plots them individually and again grouped by day. Clicking on one of the thin bars sends you to that build’s page on travis-ci.org where you can see all the available information about it.
Looking at the build durations bar chart on the left, you can see that builds have indeed gotten slower, from 15-20 minutes per build, to about 20-25 minutes.
You can inspect the build times for your own projects as well: http://scribu.github.io/travis-stats/
If you have other neat visualization ideas, open an issue on Github: https://github.com/scribu/travis-stats